Last few weeks I had a lot of discussions on how to make a VMware Private Cloud Environment accountable or measurable. In some situations, you need to design an environment that meets one or more Service Level Objectives (SLO) or you have a Service Level Agreement (SLA) with consumers of the platform. But at least you need some measurable values to scale your environment as needed. In all of these cases, you need to define Service Level Objectives for vSphere Clusters including the related infrastructure components, and collect Service Level Indicators (SLI) so monitor the defined goals.
Most of the metrics I list here are focus on availability and performance. There are many other possible objectives (business and technical) that can be measured, but I have tried to summarise the basic metrics every enterprise environment should keep in mind.
If you have any further suggestions for metrics or goals to achieve, I would be very happy if you share them with me.
Metrics for Service Level Objectives
vSphere Cluster
| Metric | Description |
|---|---|
| Average VM to Host consolidation ratio | The VM to Host consolidation ratio at first impacts the costs and the availability of the environment. More VMs per Host reduce the Hardware and License costs. Less VMs per Host reduce the Impact of a Host Failure. The VM to Host consolidation ratio needs to be balanced with other SLOs like the CPU allocation ratio. |
| Percentage of Memory allocation | Allocated memory means the sum of configured Memory and the overhead of all VMs. The Percentage of Memory allocation is in relation to your vSphere HA (and HA Admission Control) settings. For a 4-Node Cluster that can tolerate a single host failure, the Percentage of Memory allocation should not be more than 75%. For a Stretched Cluster that can tolerate a full site failure, the Percentage of Memory allocation should not be more than 50%. In very cost-sensitive setups this Objective can be even more than 100%, or just more than the planned failover reservation (e.g. 75% for a Stretched Cluster). VMware vSphere has a lot of mechanisms to make memory overcommitment possible, but from a performance perspective, this is not recommended. |
| Percentage of Memory usage | The Memory usage Objective is based on the utilization of physical memory. Typically this is what you see when you check the cluster summary or the hosts view in the vSphere Client Using this bjective for your failover resource planning is a more aggressive way: More Cost-efficient but probably with a performance impact in case of a failure. |
| CPU allocation Ratio | This Objective is also known as CPU overcommitment ratio and in contrast to memory overcommitment a typical practice in VMware vSphere environments. Which CPU overcommitment ratio is a perfect fit depends on the workload and the host’s hardware specifications. However, my personal experience has shown that 3:1 up to 4:1 (vCPU to logical thread) is often a good balance between consolidation ration and performance. |
| Percentage of CPU usage | The CPU usage Objective is based on the utilization of physical CPUs. Typically this is what you see when you check the cluster summary or the hosts view in the vSphere Client. In contrast to memory usage, CPU usage is subject to greater fluctuations. |
| Is HA enabled | This metric can only be true or false, but it is a very important Service Level Objective for most of the environments. |
| Is DRS enabled | This metric can only be true or false but can be a very important Service Level Objective for some of the environments, for example for a VMware vSphere Metro Storage Cluster configuration. |
| Number of related VMs | The number of VMs related to a vSphere Cluster can define a fault domain and the impact of a theoretical full outage of a single cluster. The full outage of a single vSphere cluster can be based on the concept of the cluster if you have multiple sile local clusters and the availability is on the application level. See my prior blog post for more details. |
ESXi Host
Most of the Metrics / Service Level Objectives for vSphere Clusters can also be applied to VMware ESXi hosts, just with different goals.
Datastore
| Metric | Description |
|---|---|
| Percentage of Disk Space allocation | Disk Space allocation means the sum of all configured VMDK sizes and VM overhead (Swap file and so on). Depending on your VMDK type (thin or thick) the importance of this objective can be pretty high. Think about a 100 GB datastore with 2 VMDKs on it, each VMDK with 100 GB configured. With thin provisioned VMDKs this setup is possible but with a high risk to run out of space if the VMs begin to allocate their Disk space. This example means 200% of Space allocation. Keep in mind that using thin provisioning for VMware vSphere VMDKs and additional space-saving technologies on the Storage Array (thin provisioning, deduplication, compression) makes good monitoring at all infrastructure layers very important! |
| Percentage of Disk Space usage | The Disk Space usage Objective is based on the current utilization of the Datastore. Typically this is what you see when you check the Datastore summary or the Datastores view in the vSphere Client. The physical utilization on the Storage Array can differ from the usage you see from VMware vSphere perspective. Most of the Storage Vendors have additional space-saving technologies to increase efficiency. |
| Number of related VMs | This Objective is a bit like the VM to Host consolidation ratio. But the pros and cons of a higher number of VMs per Datastore are slightly more complex. A smaller number of Datastores reduce operations complexity. More VMs per Datastores can result in greater Storage Efficiency on the Storage Array (Deduplication and so on). More VMs per Datastores can negatively impact Backup Performance. Less VMs per Datastores can reduce the Impact of a Storage Failure (Outage, performance problem, or out of space condition). |
Example
Let’s do a small example of how to verify the sizing of ESXi Hosts with three of the key Service Level Objectives (SLO).
Service Level Objectives:
- Average VM to Host consolidation ratio: 25 VMs per host
- Percentage of Memory allocation: max. 75%
- CPU allocation Ratio: max. 4:1
Host Sizing:
- 64 Logical Threads (2x Intel® Xeon® Gold Prozessor 6242)
- 768 GB Memory
Reverence VM #1:
- 8 vCPUs
- 16 GB Memory
| Consolidation Ratio | CPU Allocation | RAM Allocation (%) |
|---|---|---|
| 15 VMs per Host | 1,88:1 | 31,25 |
| 20 VMs per Host | 2,50:1 | 41,67 |
| 25 VMs per Host | 3,13:1 | 52,08 |
| 30 VMs per Host | 3,75:1 | 62,50 |
| 35 VMs per Host | 4,38:1 | 72,92 |
The calculation shows, that all SLOs can be met with the planned sizing and there is still some headroom for some larger VMs.
The next example shows that if the average VM in your environment is larger, the size of the host will not fit. Service Level Indicator (SLI) shows that the SLO “Percentage of Memory allocation” failed.
Reverence VM #2:
- 8 vCPUs
- 32 GB Memory
| Consolidation Ratio | CPU Allocation | RAM Allocation (%) |
|---|---|---|
| 15 VMs per Host | 1,88:1 | 62,50 |
| 20 VMs per Host | 2,50:1 | 83,33 |
| 25 VMs per Host | 3,13:1 | 104,17 |
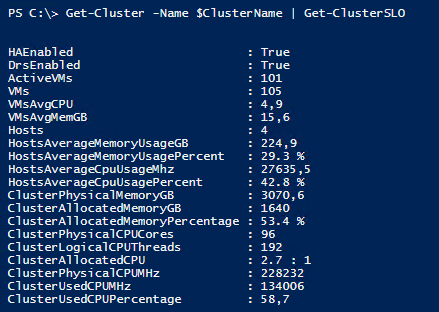
Get SLI Summary for vSphere Clusters
This VMware PowerCLI Script gathers the current SLIs of the given vSphere Cluster. The values are only a snapshot of the current state, no statistics are processed (so far).
|
|
Summary
The sample calculation of an initial sizing is just an example of how Service Level Objectives for vSphere Clusters can help to make Private Cloud Environments more accountable. The goal is to monitor the defined goals with Service Level Indicators (SLI) and define consequences when an SLO fails. Consequences can be pretty simple:
- Scale-out vSphere Cluster to reduce consolidation ratio or to optimize performance
- Add additional Datastores to reduce risk or overprovisioning
If your SLOs are designed to achieve complex goals (from a business or technical point of view), the required consequences may be on a higher complexity level.
SLO + Consequences = Service Level Agreement (SLA)
External references
- Service Level Objectives in Practice by Stephen Thorne
- Google’s SRE book - Chapter 4 - Service Level Objectives