One of the points on my bucket list for 2018 was to learn more about Grafana. So I decided to create my own Grafana Dashboard for vCloud Director. Like my vCloud Director Tenant HTML Report should the Dashboard also work from Tenant perspective. As further requirements I have decided that Ubuntu should be the platform and no external data sources should be required.
With this list of requirement I did some research to find the best fitting tools. I decided to use InfluxDB as Data Source for Grafana and Telegraf as Collector Agent. Telegraf uses Input Plugins to gather data. With the Exec Input Plugin Telegraf is able to execute a script and use the output as metric data. With PowerShell Core multi-platform support also a PowerShell script is possible, which is my preferred scripting language.
Collection Process:
- PowerShell Script utilizes the vCloud Director RESTful API to create metrics and tags
- Telegraf collects output of the Script
- Telegraf pushed the metrics and tags into InfluxDB
- Grafana Dashboard used metrics and tags from InfluxDB
Jorge de la Cruz created a great diagram of the Grafana collection workflow in his blog post: Looking for the Perfect Dashboard: InfluxDB, Telegraf and Grafana – Part VIII (Monitoring Veeam using Veeam Enterprise Manager)
Backend of the Grafana Dashboard for vCloud Director
I will give a quick wrap up of my installation on my Ubuntu 16.04 box.
InfluxDB
Add repository:
1
2
3
|
curl -sL https://repos.influxdata.com/influxdb.key | sudo apt-key add -
source /etc/lsb-release
echo "deb https://repos.influxdata.com/${DISTRIB_ID,,} ${DISTRIB_CODENAME} stable" | sudo tee /etc/apt/sources.list.d/influxdb.list
|
Install InfluxDB:
1
|
sudo apt-get update && sudo apt-get install influxdb
|
Start and enable service:
1
2
|
sudo systemctl enable influxdb
sudo systemctl start influxdb
|
Create InfluxDB user and database:
You need to enter Influx Shell first: influx
1
2
3
|
CREATE USER admin WITH PASSWORD '<Your Password>!' WITH ALL PRIVILEGES
CREATE DATABASE telegraf
exit
|

Configure connection:
Connection details need to be configured in influxdb.conf : sudo vi /etc/influxdb/influxdb.conf
1
2
3
4
|
[http]
  enabled = true
  bind-address = ":8086"
  auth-enabled = true
|

Restart service:
1
|
sudo systemctl restart influxdb
|
Telegraf
Install Telegraf and prerequirements:
1
|
sudo apt-get install telegraf snmp snmp-mibs-downloader
|
Use all installed MIBs:
You need to modify the snmp.conf: sudo vi /etc/snmp/snmp.conf
Configure output:
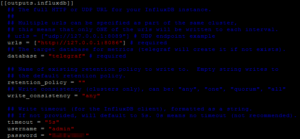
The output setting in telegraf.conf must match the InfluxDB configuration: sudo vi /etc/telegraf/telegraf.conf
1
2
3
4
5
6
7
8
|
[[outputs.influxdb]]
  urls = ["http://127.0.0.1:8086"] # required
  database = "telegraf" # required
  retention_policy = ""
  write_consistency = "any"
  timeout = "5s"
  username = "admin"
  password = "<Password>"
|

Grafana
Add repository:
1
2
|
echo "deb https://packagecloud.io/grafana/stable/debian/ jessie main" | sudo tee /etc/apt/sources.list.d/grafana.list
curl https://packagecloud.io/gpg.key | sudo apt-key add -
|
Install Grafana:
1
|
sudo apt-get update && sudo apt-get install grafana
|
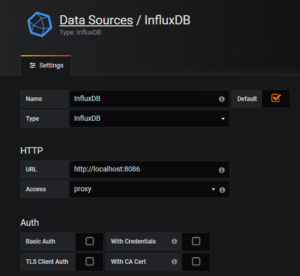
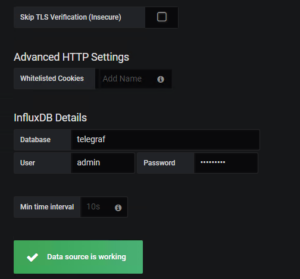
You are now able to access the Grafana site via http://:3000 and configure the InfluxDB data source:


PowerShell
Add repository:
1
2
|
curl https://packages.microsoft.com/keys/microsoft.asc | sudo apt-key add -
curl https://packages.microsoft.com/config/ubuntu/16.04/prod.list | sudo tee /etc/apt/sources.list.d/microsoft.list
|
Install PowerShell:
1
|
sudo apt-get update && sudo apt-get install powershell
|
Configuration of the Grafana Dashboard for vCloud Director
Telegraf
Just append a new section to the telegraf.conf : sudo vi /etc/telegraf/telegraf.conf
1
2
3
4
5
6
|
[[inputs.exec]]
  commands = ["pwsh /scripts/Grafana-Telegraf-vCloud-PsCore/vCloud.ps1"]
  name_override = "vCloudStats"
  interval = "60s"
  timeout = "60s"
  data_format = "influx"
|
PowerShell Script
To run the Script a json file for the configuration is needed in addition. Both files (config only as example) are available in my GitHub Repository Grafana-Telegraf-vCloud-PsCore. I typically use git to sync the script between my workstation and the Grafana box: just use initially git clone https://github.com/vMarkusK/Grafana-Telegraf-vCloud-PsCore.git and for updates git pull.
  1
  2
  3
  4
  5
  6
  7
  8
  9
 10
 11
 12
 13
 14
 15
 16
 17
 18
 19
 20
 21
 22
 23
 24
 25
 26
 27
 28
 29
 30
 31
 32
 33
 34
 35
 36
 37
 38
 39
 40
 41
 42
 43
 44
 45
 46
 47
 48
 49
 50
 51
 52
 53
 54
 55
 56
 57
 58
 59
 60
 61
 62
 63
 64
 65
 66
 67
 68
 69
 70
 71
 72
 73
 74
 75
 76
 77
 78
 79
 80
 81
 82
 83
 84
 85
 86
 87
 88
 89
 90
 91
 92
 93
 94
 95
 96
 97
 98
 99
100
101
102
103
104
105
106
107
108
|
$ConfigFile = "$PSScriptRoot/Config.json"
$Configs = Get-Content -Raw -Path $ConfigFile -ErrorAction Continue | ConvertFrom-Json -ErrorAction Continue

if (!($Configs)) {
    Throw "Import JSON Config Failed"
    }

$VcdHost = $Configs.Base.VcdHost
$BasicAuth = $Configs.Base.BasicAuth

#region: Login
$Uri = "https://$VcdHost/api/sessions"
$Authorization = 'Basic {0}' -f $BasicAuth
$Headers =  @{'accept' = 'application/vnd.vmware.vcloud.session+xml;version=27.0'; 'Authorization' = $Authorization}
$ResponseHeaders = $null
$Login = Invoke-RestMethod -uri $Uri -Method Post -Headers $Headers -ResponseHeadersVariable 'ResponseHeaders'
#endregion

#region: Cleanup Confidential Data
Clear-Variable -Name BasicAuth, Authorization, Headers
#endregion

#region: Get vApps
$Uri = "https://$VcdHost/api/query?type=orgVdc"
$Headers =  @{'accept' = 'application/*+xml;version=27.0'; 'x-vcloud-authorization' = [String]$ResponseHeaders.'x-vcloud-authorization'}
[XML]$orgVdcs = Invoke-RestMethod -uri $Uri -Method Get -Headers $Headers
#endregion

#region: Get vApps
$Uri = "https://$VcdHost/api/query?type=vApp"
$Headers =  @{'accept' = 'application/*+xml;version=27.0'; 'x-vcloud-authorization' = [String]$ResponseHeaders.'x-vcloud-authorization'}
[XML]$vApps = Invoke-RestMethod -uri $Uri -Method Get -Headers $Headers
#endregion

#region: Get VMs
$Uri = "https://$VcdHost/api/query?type=vm"
$Headers =  @{'accept' = 'application/*+xml;version=27.0'; 'x-vcloud-authorization' = [String]$ResponseHeaders.'x-vcloud-authorization'}
[XML]$VMs = Invoke-RestMethod -uri $Uri -Method Get -Headers $Headers
#endregion

#region: Get orgNetworks
$Uri = "https://$VcdHost/api/query?type=orgNetwork"
$Headers =  @{'accept' = 'application/*+xml;version=27.0'; 'x-vcloud-authorization' = [String]$ResponseHeaders.'x-vcloud-authorization'}
[XML]$orgNetworks = Invoke-RestMethod -uri $Uri -Method Get -Headers $Headers
#endregion

#region: Get edgeGateway
$Uri = "https://$VcdHost/api/query?type=edgeGateway"
$Headers =  @{'accept' = 'application/*+xml;version=27.0'; 'x-vcloud-authorization' = [String]$ResponseHeaders.'x-vcloud-authorization'}
[XML]$edgeGateways = Invoke-RestMethod -uri $Uri -Method Get -Headers $Headers
#endregion

#region: Output
## Simple Stats
$orgVdcsTotal = ([Array]$orgVdcs.QueryResultRecords.OrgVdcRecord).Count
$body="vCloudStats orgVdcCountTotal=$orgVdcsTotal"
Write-Host $body
$vAppsTotal = ([Array]$vApps.QueryResultRecords.VAppRecord).Count
$body="vCloudStats vAppCountTotal=$vAppsTotal"
Write-Host $body
$VMsTotal = ([Array]$VMs.QueryResultRecords.VMRecord | Where-Object {$_.isVAppTemplate -ne "true"}).Count
$body="vCloudStats VMCountTotal=$VMsTotal"
Write-Host $body
$VMsPoweredOff = ([Array]$VMs.QueryResultRecords.VMRecord | Where-Object {$_.isVAppTemplate -ne "true" -and  $_.status -eq "POWERED_OFF"}).Count
$body="vCloudStats VMCountPoweredOff=$VMsPoweredOff"
Write-Host $body
$orgNetworksTotal = $orgNetworks.QueryResultRecords.OrgNetworkRecord.Count
$body="vCloudStats orgNetworkCountTotal=$orgNetworksTotal"
Write-Host $body
$edgeGatewaysTotal = ([Array]$edgeGateways.QueryResultRecords.EdgeGatewayRecord).Count
$body="vCloudStats edgeGatewaysTotal=$edgeGatewaysTotal"
Write-Host $body

## OrgVdc Details
foreach ($item in [Array]$orgVdcs.QueryResultRecords.OrgVdcRecord) {
    $body = "vCloudStats,orgVdc=$($item.name),isEnabled=$($item.isEnabled) cpuUsedMhz=$($item.cpuUsedMhz),memoryUsedMB=$($item.memoryUsedMB),numberOfMedia=$($item.numberOfMedia),numberOfVAppTemplates=$($item.numberOfVAppTemplates),numberOfVApps=$($item.numberOfVApps),storageUsedMB=$($item.storageUsedMB)"
        Write-Host $body
}
## vApp Details
foreach ($item in [Array]$vApps.QueryResultRecords.VAppRecord) {
    $body = "vCloudStats,vApp=$($item.name),status=$($item.status) numberOfVMs=$($item.numberOfVMs),numberOfCpus=$($item.numberOfCpus),cpuAllocationInMhz=$($item.cpuAllocationInMhz),memoryAllocationMB=$($item.memoryAllocationMB),storageKB=$($item.storageKB)"
        Write-Host $body
}
## orgNetwork Details
foreach ($item in [Array]$orgNetworks.QueryResultRecords.OrgNetworkRecord) {
    $Uri = [string]$item.href + "/allocatedAddresses"
    $Headers =  @{'accept' = 'application/*+xml;version=27.0'; 'x-vcloud-authorization' = [String]$ResponseHeaders.'x-vcloud-authorization'}
    [XML]$orgNetworkAllocated = Invoke-RestMethod -uri $Uri -Method Get -Headers $Headers
    $AllocatedIpAddressesTotal = $orgNetworkAllocated.AllocatedIpAddresses.IpAddress.Count
    $body = "vCloudStats,orgNetwork=$($item.name),gateway=$($item.gateway) AllocatedIpAddressesTotal=$AllocatedIpAddressesTotal"
        Write-Host $body
}
## Edge Details
foreach ($item in [Array]$edgeGateways.QueryResultRecords.EdgeGatewayRecord) {
    $body = "vCloudStats,edgeGateway=$($item.name),gatewayStatus=$($item.gatewayStatus),haStatus=$($item.haStatus) numberOfExtNetworks=$($item.numberOfExtNetworks),numberOfOrgNetworks=$($item.numberOfOrgNetworks)"
        Write-Host $body
}
#endregion

#region: Logout
$Uri = "https://$VcdHost/api/session"
$Headers =  @{'accept' = 'application/vnd.vmware.vcloud.session+xml;version=27.0'; 'x-vcloud-authorization' = [String]$ResponseHeaders.'x-vcloud-authorization'}
$Logout = Invoke-RestMethod -uri $Uri -Method Delete -Headers $Headers
#endregion

#region: Cleanup Confidential Data
Clear-Variable -Name ResponseHeaders, Headers
#endregion
|
The json configuration contains the FQDN of the vCloud Director instance and the Base64 Hash of Username and Password.
1
2
3
4
5
6
|
{
    "Base": {
            "VcdHost": "<FQDN>",
            "BasicAuth": "<Base64>"
        }
    }
|
Note:
The un-hashed username format needs to be: @
The Base64 hash can be created with a simple PowerShell Script:
1
2
3
|
[String] $User		= "<User>@<Org>"
[String] $Password	= "<Password>"
Write-Host "Basic String: " $([Convert]::ToBase64String([Text.Encoding]::ASCII.GetBytes("$($user):$($password)")))
|
Details of Grafana Dashboard for vCloud Director
The Dashboard has at the moment four different sections, Summary, OrgVdc Usage, vApp Usage and Org Network / Edge Gateway Usage.
Summary
The Summary section shows the most import stats of your organization.

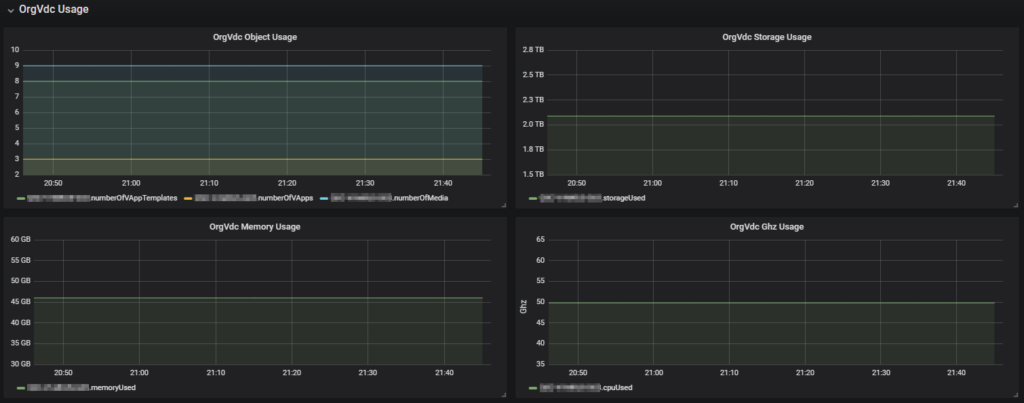
OrgVdc Usage
In this section the resource usage per OrgVdc is visualized.

vApp Usage
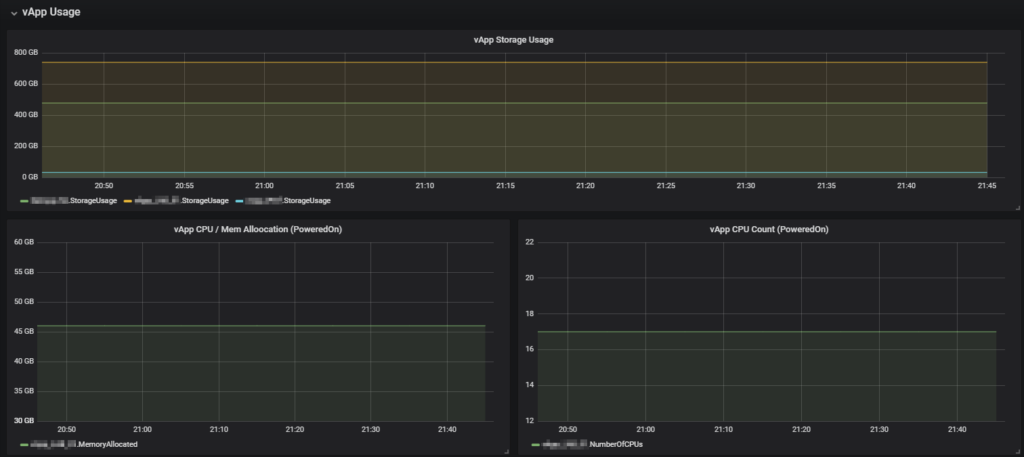
In this section the storage usage of all vApp and CPU und RAM usage of powered on vApps is visualized.

Org Network and Edge Gateway Usage
This sections visualizes the IP allocation per Org Network and number of connected networks per Edge Gateway.


